


Breaking Down The Construction Industry - Infographic
Note: It is not clear what the figures for industry revenue and output in this infographic refer to. Construction industry annual output is actually in the order of £100bn, depending the exact measure and index year. See Office for National Statistics for more information.
We have created an infographic showing various statistics within the British construction industry including revenue, employment and business statistics, health and safety statistics and many more. This is a good infographic to read if you are considering a career within the construction industry. The information shown below has been taken from a variety of different sources including the HSE, OBAS, Ibis World and the UK government.
See more Construction industry infographics.

Featured articles
Check out some of the best features and news from Designing Buildings as well as key stories from around the web.

ECA welcomes plans to strengthen subcontractor quality control.

Combining mid-career qualifications with experience broadens career opportunities.
![]()
Why being a mentor can help your career.

Channel 4 broadcaster to host 125th anniversary ceremony.
Listed structures on the rail network
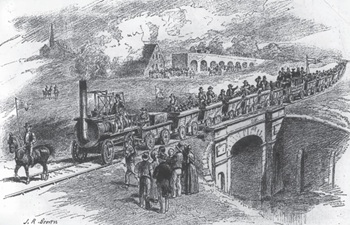
Heritage interests and operational requirements must be balanced.
Historic England publishes research into embodied carbon when retrofitting traditional buildings.

New Prime Minister delivers on ECA call for cut in electricity costs.

CIOB reacts to the announcement of Andy Burnham as Prime Minister.

Heritage and conservation science workforce survey - Have your say.

England's Suburbs 1820-2020. Book review.

New, more proportionate and targeted approach for higher-risk building assessments.

Government brings British Steel into public ownership.